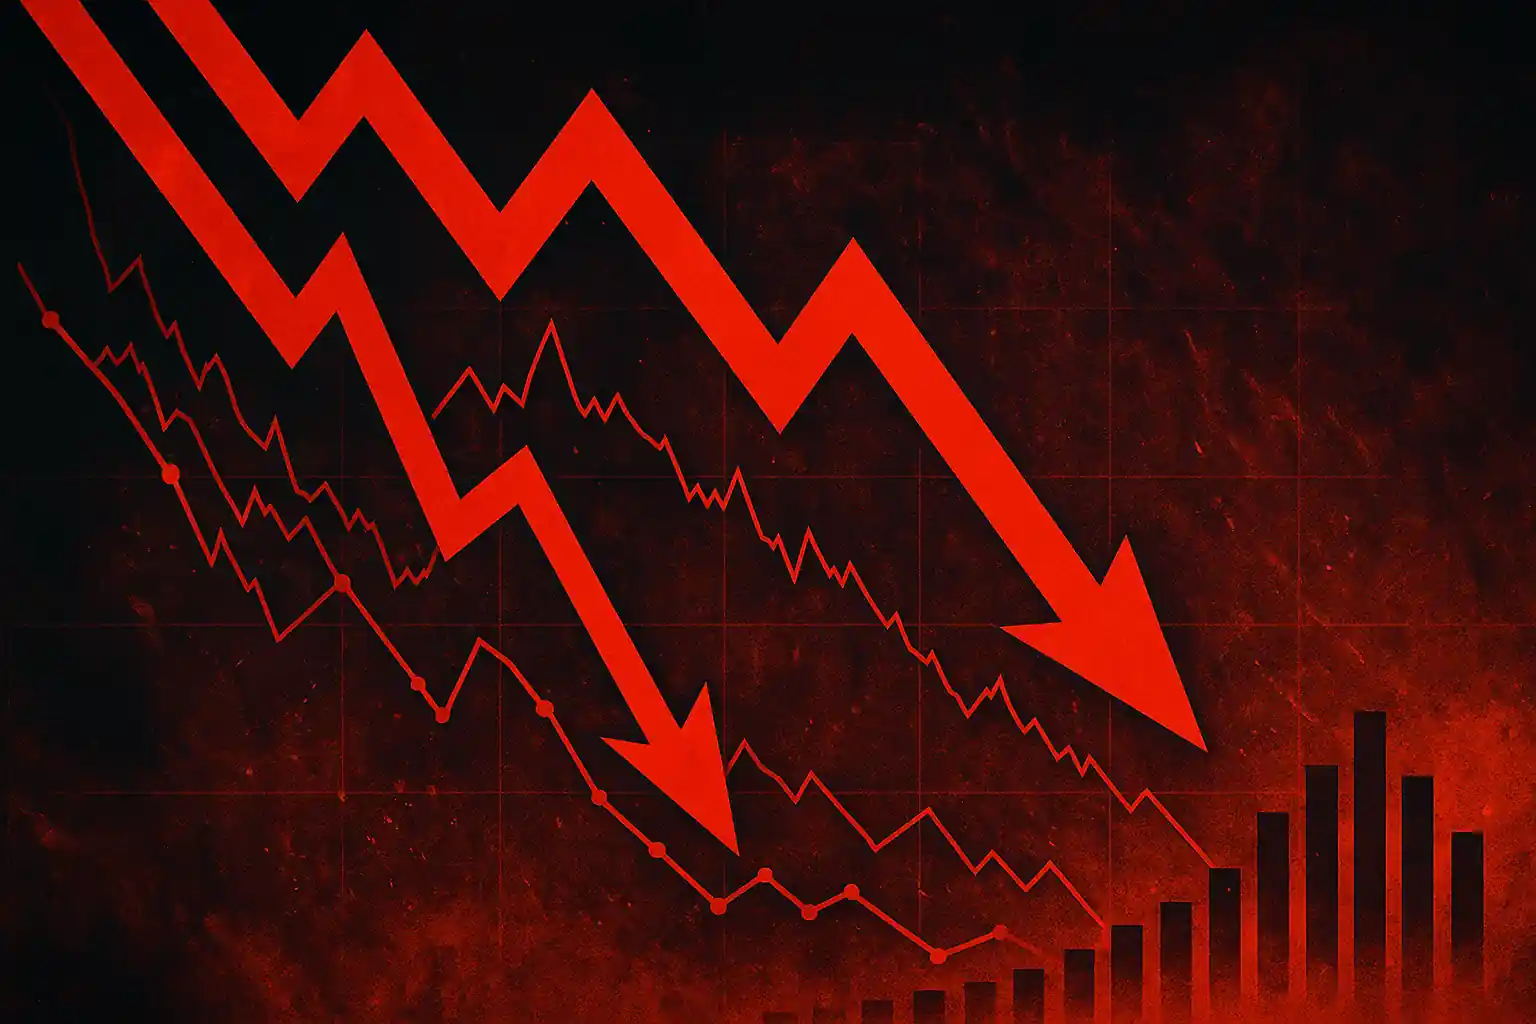
Why Markets Crashed on October 10, 2025: Shutdown Chaos, Data Freeze, and Tariff Shock

A Perfect Storm: Shutdown Uncertainty Meets Tariff Escalation
Markets entered October on edge. On Oct. 1 the federal government shut down after Congress failed to pass a continuing resolution. By Oct. 10 the shutdown was in its second week, halting routine operations at many agencies and creating a data blackout. The U.S. Bureau of Labor Statistics said its site would not update until the government reopened (source). Without fresh jobs or inflation data, investors were guessing. The Joint Economic Committee noted its monthly employment update had to rely on Job Openings and Labor Turnover Survey inputs because the Employment Situation report could not be released during the shutdown (source). The Atlanta Fed similarly flagged limited inputs and deferred updating its GDPNow tracking when government data were unavailable (source). Late on Oct. 10, the Office of the U.S. Trade Representative announced changes in a Section 301 action targeting China’s maritime and logistics sectors—imposing a 100% tariff on certain ship-to-shore cranes and setting a $46 per net ton fee on foreign-built vehicle carriers effective Oct. 14, while proposing further changes including duties up to 150% on additional cargo-handling gear (source). Those policy surprises, stacked on a data freeze, triggered broad selling in transportation, industrial and tech shares.🚫 BLS website updates suspended during shutdown
📊 Employment Situation report unavailable
🔮 GDPNow guidance constrained/deferred
💰 100% tariffs on certain port cranes
📦 Proposed up to 150% tariffs on cargo-handling gear
Government Shutdown Disrupts Critical Services and Data
Beyond Wall Street, industry groups warned about real-world impacts. Letters compiled on the White House shutdown hub described supply-chain and workforce risks, and urged prompt passage of stopgap funding (source). A separate White House brief summarized national effects—from unpaid essential workers to pressure on WIC and other programs (source). On Capitol Hill, House Financial Services Committee Democrats reported that by Day 10 more than 250,000 federal employees had already missed scheduled paychecks, with travel disruptions and broader economic knock-ons emerging (source). The policy standoff undermined confidence and consumer spending just as markets grappled with tariff news.🛩️ Industry letters flagged aerospace/FAA risks
🥫 WIC and key programs under strain
👷 250,000+ federal workers missed paychecks
✈️ Reports of travel/FAA disruptions
Tariff Shock: Section 301 Action Raises Fees and Duties
The Oct. 10 USTR move expanded an April action and clarified fee mechanics for foreign-built vehicle carriers—$46 per net ton from Oct. 14—and immediately applied 100% tariffs to specified ship-to-shore cranes, while proposing up to 150% duties on additional rubber-tire gantry equipment and components (source). Because most large container cranes are sourced from China, port modernization costs and logistics timetables became a near-term risk, weighing on shippers, logistics firms and capital-goods names.⚖️ $46 per net ton fee on foreign-built vehicle carriers (from Oct. 14, 2025)
🚢 100% tariff on certain ship-to-shore cranes
🔧 Proposed up to 150% on added cargo-handling gear
🗓️ Implementation/proposal windows spelled out in USTR notice
Data Blackout and Investor Psychology
With BLS releases paused and GDPNow constrained, traders lacked anchors for inflation and growth. The BLS posted a shutdown banner explaining halted updates (source). The JEC explained its October employment note used only JOLTS given the lapse (source). The Atlanta Fed’s GDPNow page described limited inputs and deferred updates when key government series were unavailable (source). Add the tariff jolt—and risk-parity funds and systematic strategies likely de-risked in tandem, amplifying downside moves.📈 CPI and Employment Situation not released during shutdown
🔍 JEC note leaned on JOLTS only
📉 GDPNow deferred/limited without federal inputs
⚠️ Higher macro uncertainty → wider risk premiums
Scoreboard: Index Losses on the Day
Major U.S. benchmarks posted their steepest daily pullback since spring. On Friday, Oct. 10, 2025 the S&P 500 fell 2.7% to 6,552.51, the Dow Jones Industrial Average dropped 1.9% (−878.82) to 45,479.60, and the Nasdaq Composite slid 3.6% to 22,204.43, with the small-cap Russell 2000 down 3.0% (source).S&P 500: −2.7% to 6,552.51
Dow: −1.9% (−878.82) to 45,479.60
Nasdaq: −3.6% to 22,204.43
Russell 2000: −3.0% to 2,394.59
How Much Value Vanished: The One-Day Dollar Hit
To gauge the dollar impact across the whole U.S. equity market, a practical yardstick is the FT Wilshire 5000 Full Cap Index. The index level fell from 67,327.12 on Oct. 9 to 65,495.26 on Oct. 10—a decline of 1,831.86 points (source). Because one Wilshire 5000 index point corresponds to roughly $1 billion in total U.S. market capitalization (per Wilshire’s original construction and subsequent references), that single-day drop implies about $1.83 trillion in paper value erased across U.S. equities (source). This is an approximation, but it aligns with the day’s broad, policy-driven selloff noted above.Wilshire 5000: 67,327.12 → 65,495.26
Point change: −1,831.86
Approx. dollar change: ~$1.83 trillion
What Investors Can Learn
October’s break shows how policy friction can move markets fast. A prolonged shutdown doesn’t just inconvenience federal workers; it also freezes critical data and complicates rate and growth expectations. Industry letters aggregated by the White House stressed national-security and supply-chain concerns, while federal employees missed paychecks and travel disruptions mounted (source; source). Meanwhile, the USTR’s targeted port-equipment tariffs injected new logistics costs (source). Playbook: keep liquidity buffers, diversify across sectors and factors, and track official calendars for policy updates.🧠 Policy risk can spark sudden repricing
🥛 Maintain liquidity for shock days
📆 Monitor official data and trade actions